

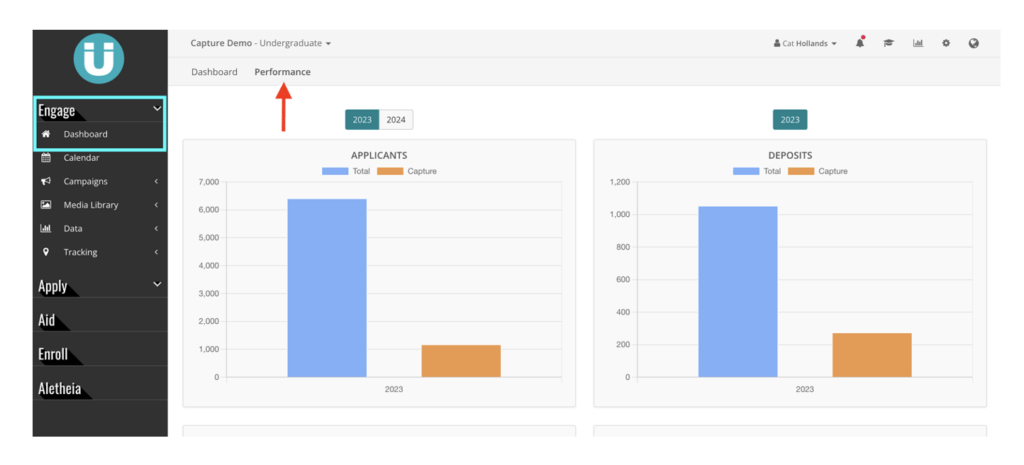
The option to toggle between your main Engage dashboard and your Performance dashboard has been moved to the top of your main landing page. The Performance dashboard gives you plenty of data points, from Capture’s effect on your applicant and deposit pool, to your institutional goals, to the ability to drill into your market segments or student buckets.
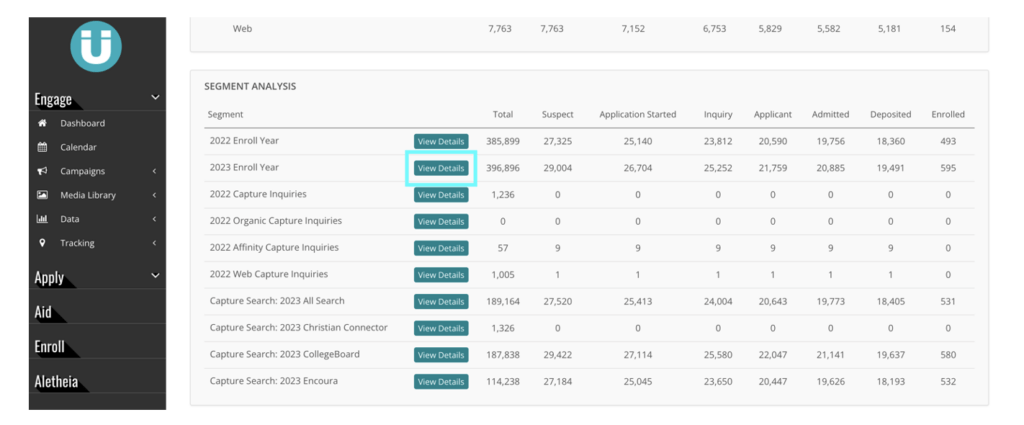
We’ve enhanced the functionality of your market segments, so you can now drill even deeper into what state and actual cities your funnel is coming from.
To the right of your market segments, you will see a “View Detail” button:
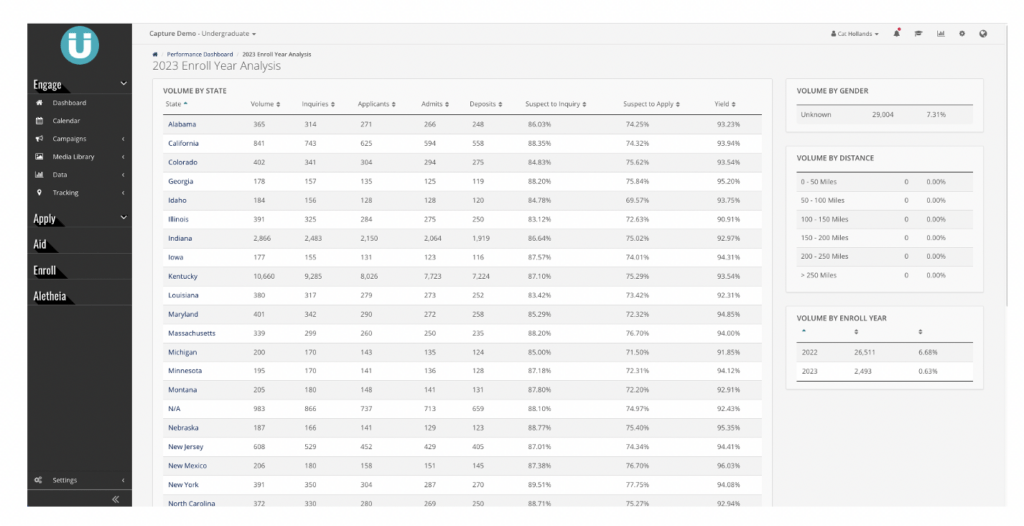
Clicking this button will take you into your funnel counts per State, Volume by Distance and Enroll Year:
Now, click on the State of interest and you can go one step further into the exact city … and the funnel counts from each, showing you where you are gaining ground:
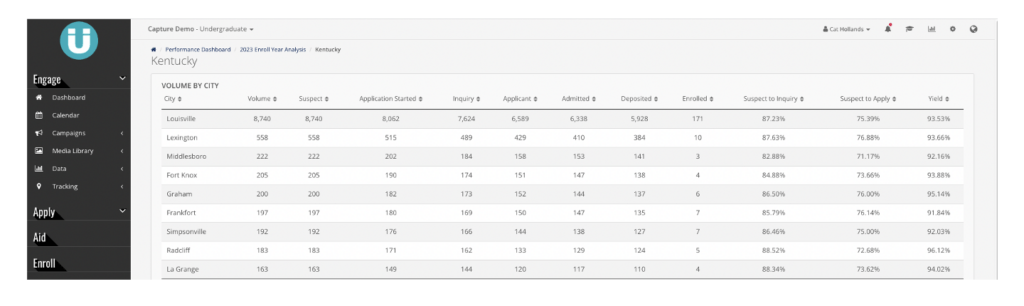
Tips for using this data: Try identifying areas where you can increase visibility, or where you might want to send mailing campaigns. Additionally, this feature can assist in helping decide where to purchase names … or ramp up visits to an area.
Your Performance dashboard is a helpful data tool. Please reach out to myself [chollands@capturehighered.com] or your account executive if you would like assistance utilizing and understanding this feature.
By Cat Hollands, Client Trainer, Capture Higher Ed
